Financial Inclusion.
Impact & Transparency Data. Indexed.

Navigate the sector with ease. Independently researched.

See what's inside
3,374
Financial institutions
101
Funders
139
Countries
9,083
Recorded investments
Last updated
What's inside

Financial inclusion data. In one place.

01 · Institutions

Who funds it? Is pricing transparent? Does it report impact?
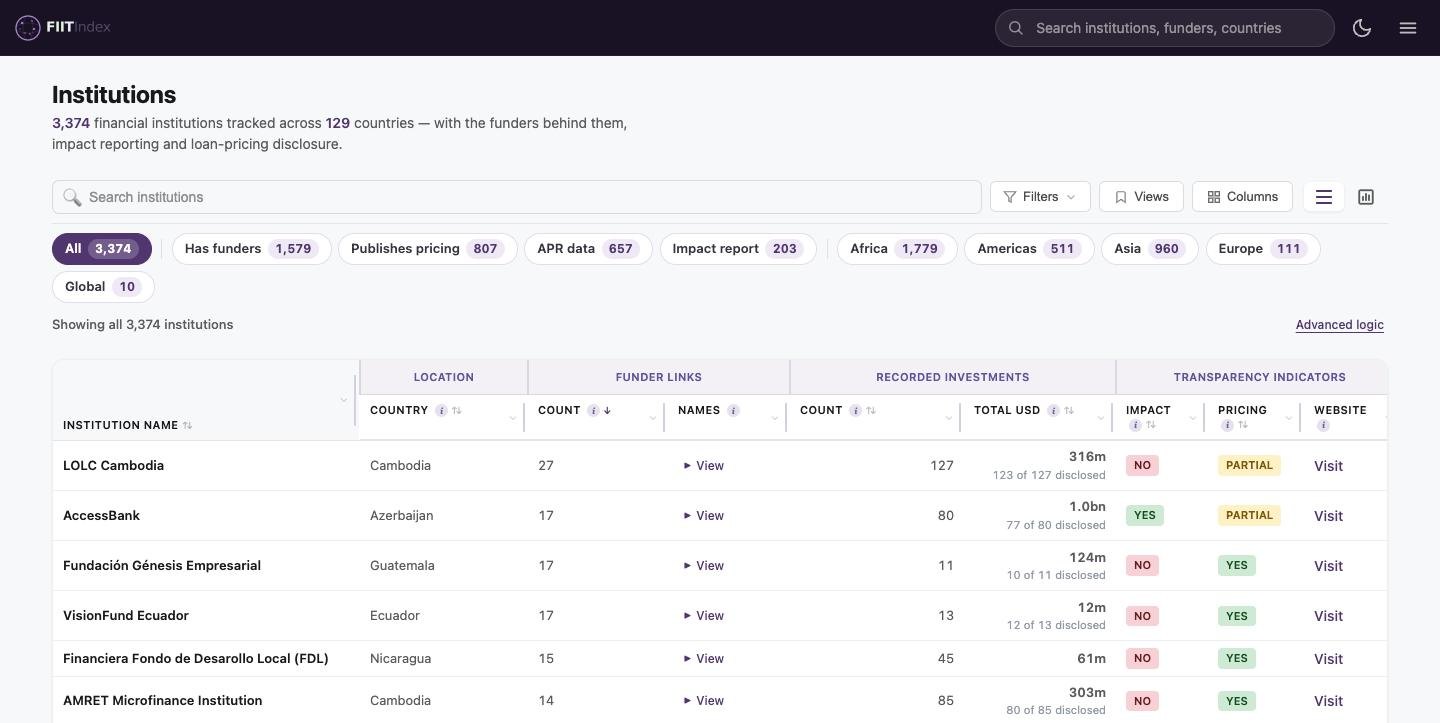
The FIIT Institutions table: each financial institution with its country, funder links, recorded investments and transparency indicators for impact reporting, pricing and website.
02 · Funders

Who does each funder back, and how transparent are they?
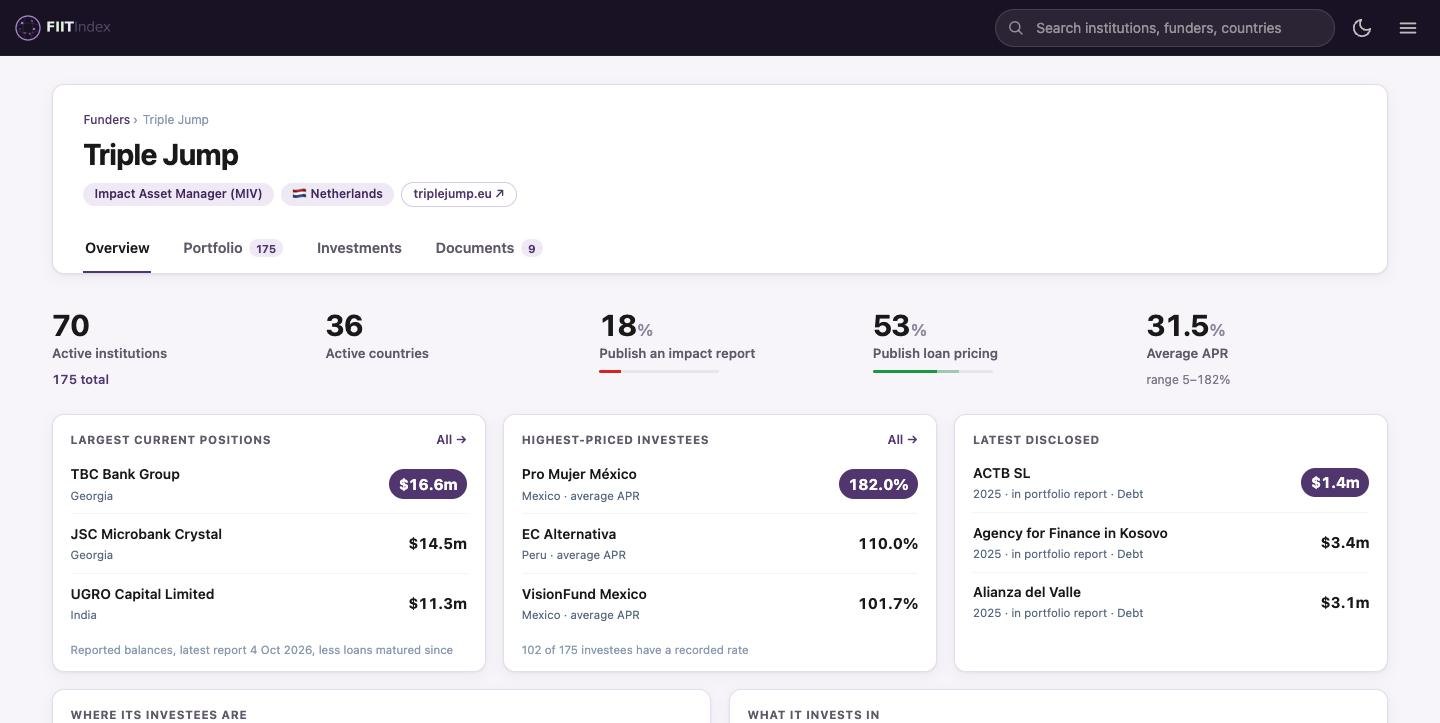
A FIIT funder page for Triple Jump: active institutions and countries, the share of investees publishing an impact report and loan pricing, average APR, largest positions and highest-priced investees.
03 · Investments

Where did the money go?
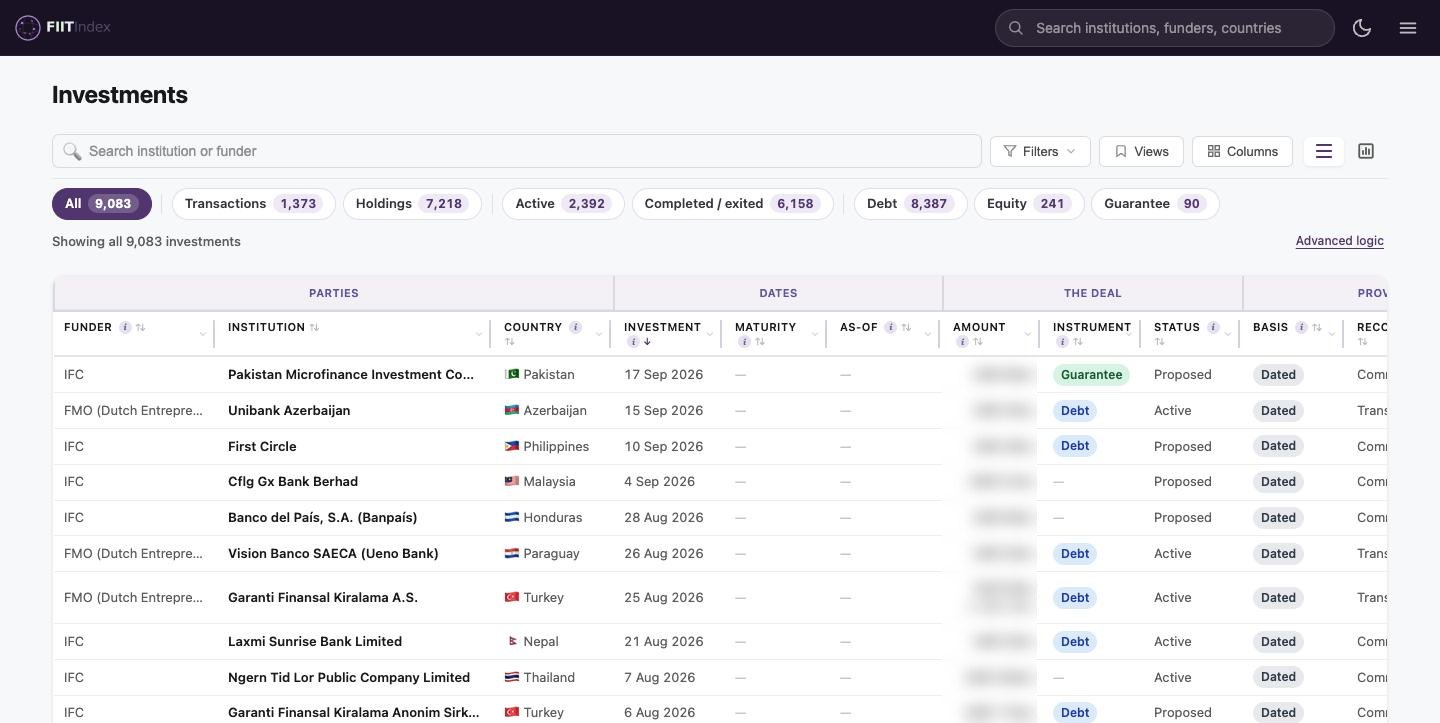
The FIIT Investments ledger: funder, institution, country, investment date, amount, instrument and status for each recorded investment.
04 · Data Lab

For deeper analytics.

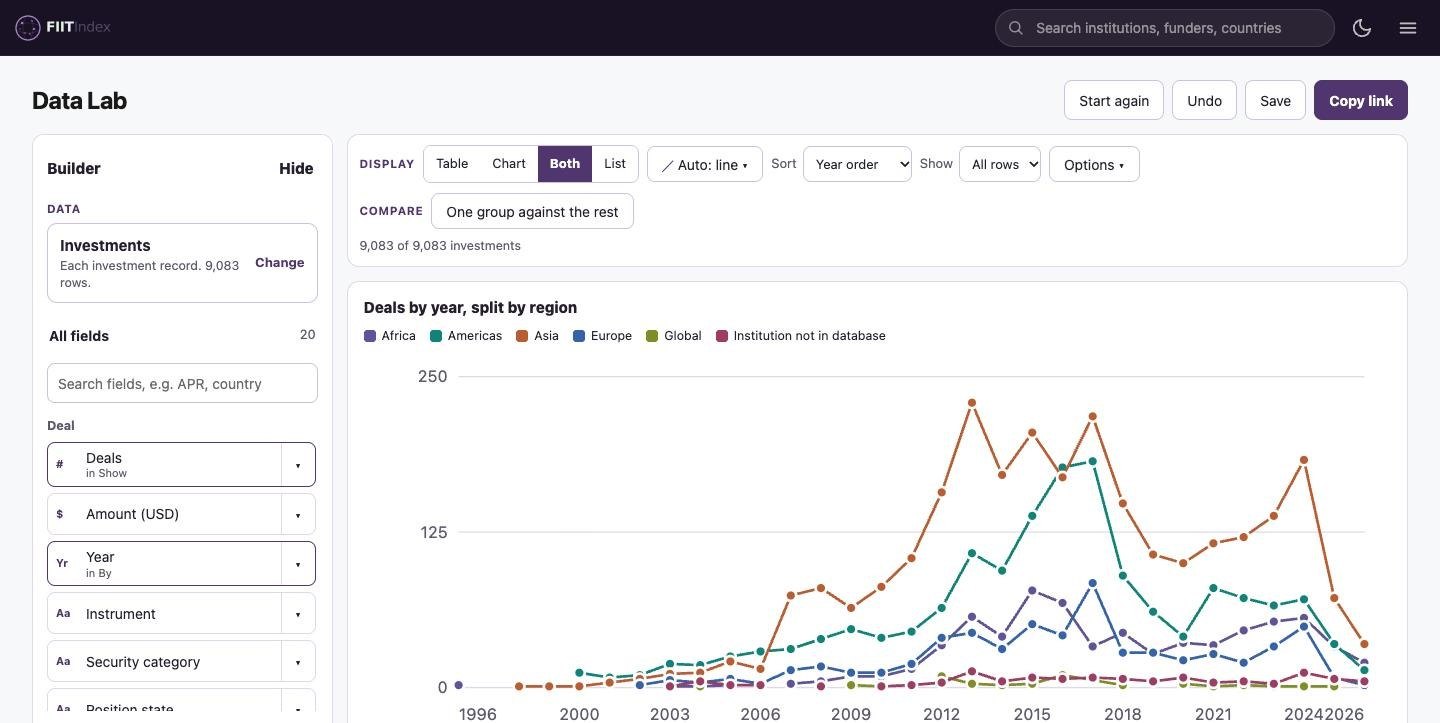
The FIIT Data Lab: a line chart of investment deals by year, split by region (Africa, Americas, Asia, Europe), built from the Investments table.

A tool for transparency
in financial inclusion

Get in touch

Request access